Visualize the Freifunk Mesh
Find a file
2015-04-17 23:51:03 +02:00
doc README: add screenshots 2015-04-01 17:07:50 +02:00
html sidebar styling 2015-04-04 18:01:57 +02:00
img forcegraph: optimize background image 2015-04-02 02:46:19 +02:00
lib map: less obstrusive client color 2015-04-17 23:51:03 +02:00
scss button for adding tile layer 2015-04-15 21:14:52 +02:00
tasks map: adding custom layers 2015-04-15 22:25:44 +02:00
.gitignore switch to sass 2015-03-31 15:39:41 +02:00
.travis.yml add travis-ci 2015-04-01 17:53:30 +02:00
app.js leaflet providers 2015-04-15 21:14:51 +02:00
bower.json leaflet providers 2015-04-15 21:14:51 +02:00
build.js refactor main, app 2015-03-29 04:35:20 +02:00
CHANGELOG.md forcegraph: backport client circles from ffmap-d3 2015-04-16 20:16:49 +02:00
Gruntfile.js switch to sass 2015-03-31 15:39:41 +02:00
helper.js helper/has_location: validate coordinates (+-90, +-180) 2015-04-10 14:51:07 +02:00
images map: adding custom layers 2015-04-15 22:25:44 +02:00
index.html sidebar styling 2015-04-04 18:01:57 +02:00
LICENSE change LICENSE to AGPL 3 2015-04-11 13:40:15 +02:00
package.json make linkId a property (id) of link 2015-04-06 23:10:37 +02:00
README.md README: sass >= 3.2 is required 2015-04-14 21:45:52 +02:00
style.css switch to sass 2015-03-31 15:39:41 +02:00

Build Status

Meshviewer

Meshviewer is a frontend for ffmap-backend.

Changelog

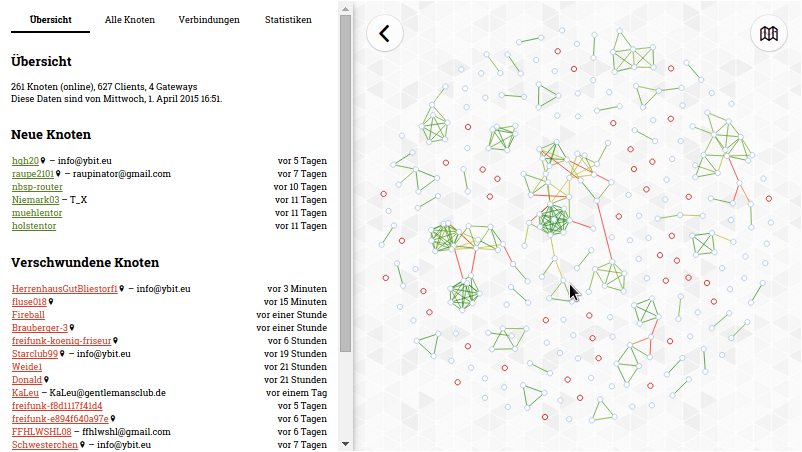
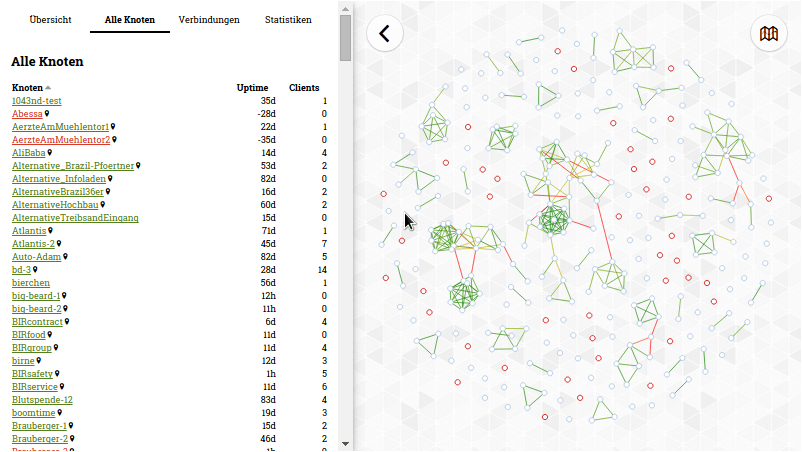
Screenshots

Dependencies

  • npm
  • bower
  • grunt-cli
  • Sass (>= 3.2)

Installing dependencies

npm install
bower install

Building

You may want to tweak lib/config.js to point to your data files. If it's served from a different domain, remember to enable CORS on your webserver. Enabling GZip will reduce bandwidth consumption.

Just run:

grunt

This will generate build/ containing all required files.