- JavaScript 89.3%
- SCSS 9.6%
- HTML 1.1%
| doc | ||
| html | ||
| lib | ||
| scss | ||
| tasks | ||
| .gitignore | ||
| .travis.yml | ||
| app.js | ||
| bower.json | ||
| build.js | ||
| CHANGELOG.md | ||
| config.json.example | ||
| Gemfile | ||
| Gemfile.lock | ||
| Gruntfile.js | ||
| helper.js | ||
| images | ||
| index.html | ||
| LICENSE | ||
| package.json | ||
| README.md | ||
| style.css | ||
HopGlass
HopGlass is a frontend for the HopGlass Server.
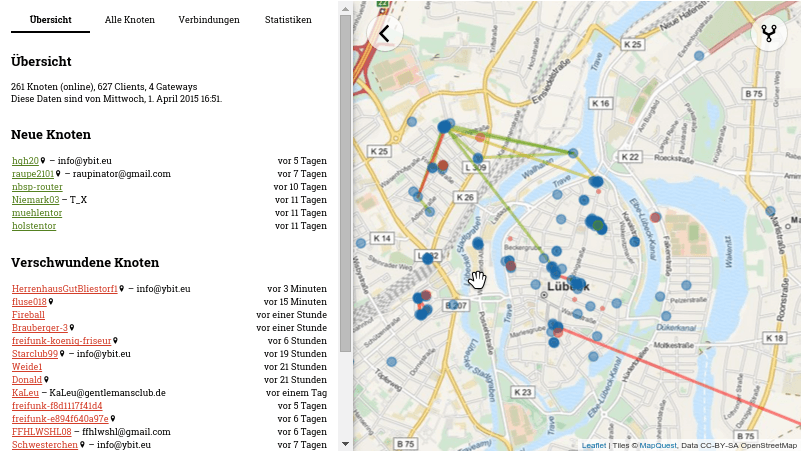
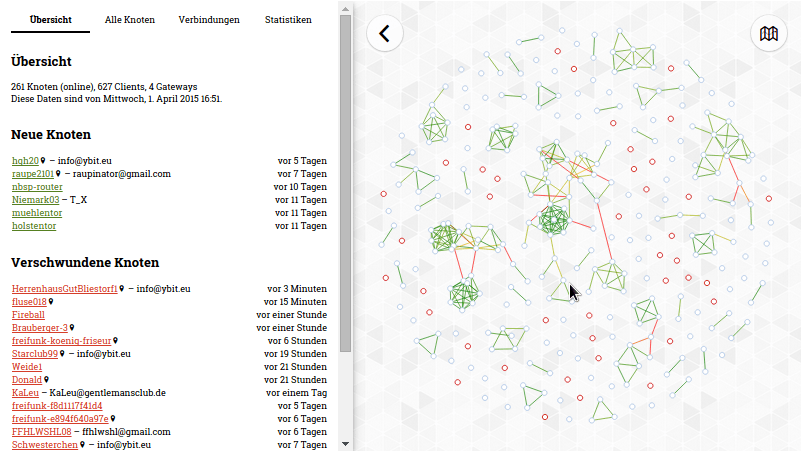
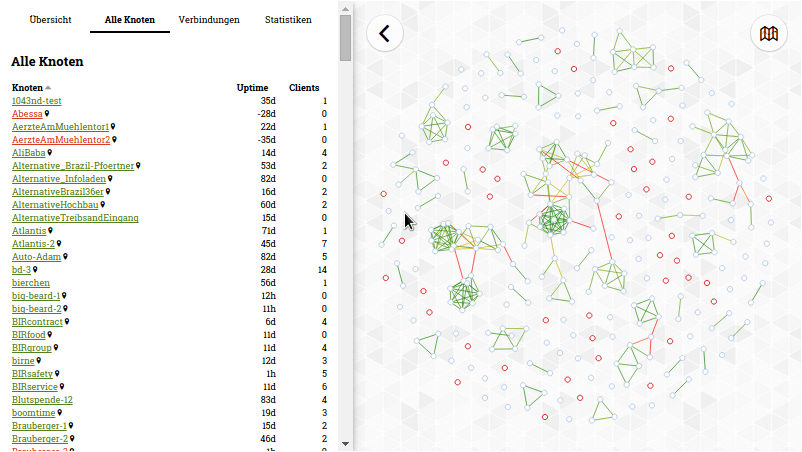
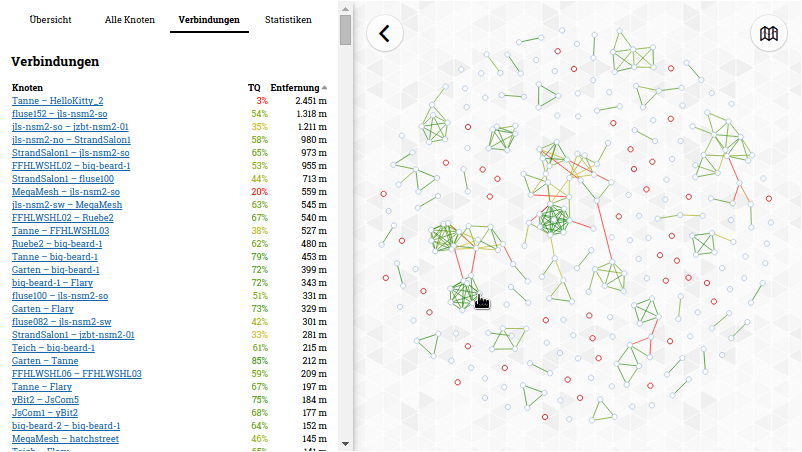
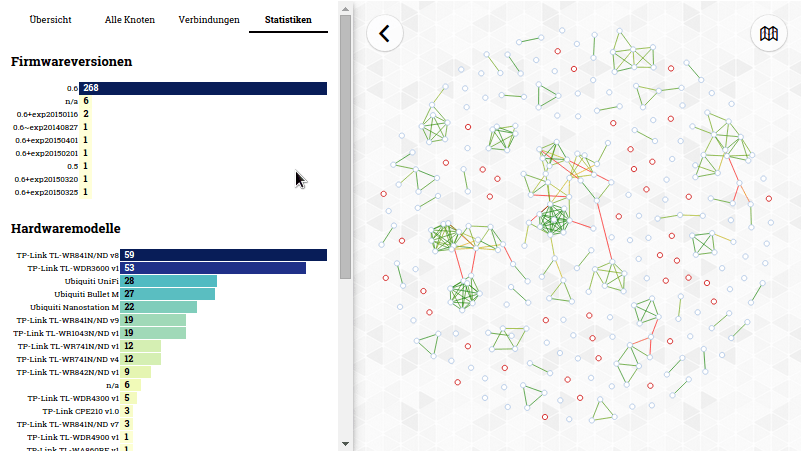
Screenshots
Dependencies
- npm
- bower
- grunt-cli
- Sass (>= 3.2)
Installing dependencies
Install npm and Sass with your package-manager. On Debian-like systems run:
sudo apt-get install npm ruby-sass
or if you have bundler you can install ruby-sass simply via bundle install
On Mac you have to install only npm via brew and sass
/usr/bin/ruby -e "$(curl -fsSL https://raw.githubusercontent.com/Homebrew/install/master/install)"
brew install node
sudo gem install sass
Execute these commands on your server as a normal user to prepare the dependencies:
git clone https://github.com/plumpudding/hopglass
cd hopglass
npm install
npm install grunt-cli
Building
Just run the following command from the hopglass directory:
node_modules/.bin/grunt
This will generate build/ containing all required files.
Configure
Copy config.json.example to build/config.json and change it to match your community.
dataPath (string/array)
dataPath can be either a string containing the address of a HopGlass Server or an array containing multiple addresses.
Don't forget the trailing slash!
Also, proxying the data through a webserver will allow GZip and thus will greatly reduce bandwidth consumption.
It may help with firewall problems too.
siteName (string)
Change this to match your communities' name. It will be used in various places.
mapSigmaScale (float)
This affects the initial scale of the map. Greater values will show a larger area. Values like 1.0 and 0.5 might be good choices.
showContact (bool)
Setting this to false will hide contact information for nodes.
maxAge (integer)
Nodes being online for less than maxAge days are considered "new". Likewise, nodes being offline for more than than maxAge days are considered "lost".
mapLayers (List)
A list of objects describing map layers. Each object has at least name
property and optionally url and config properties. If no url is supplied
name is assumed to name a
Leaflet-provider.
fixedCenter (array, optional)
This option allows to fix the map at one specific coordinate depending on following case-sensitive parameters:
latlatitude of the center pointlnglongitude of the center pointradiusvisible radius around the center in km
Examples for fixedCenter:
"fixedCenter": {
  "lat": 50.80,
  "lng": 12.07,
  "radius": 30
}
nodeInfos (array, optional)
This option allows to show node statistics depending on following case-sensitive parameters:
namecaption of statistics segment in infoboxhrefabsolute or relative URL to statistics imagethumbnailabsolute or relative URL to thumbnail image, can be the same likehrefcaptionis shown, ifthumbnailis not present (no thumbnail in infobox)
To insert current node-id in either href, thumbnail or caption
you can use the case-sensitive template string {NODE_ID}.
Examples for nodeInfos:
"nodeInfos": [

  { "name": "Clientstatistik",
    "href": "stats/dashboard/db/node-byid?var-nodeid={NODE_ID}",
    "thumbnail": "stats/render/dashboard-solo/db/node-byid?panelId=1&fullscreen&theme=light&width=600&height=300&var-nodeid={NODE_ID}"
    "caption": "Knoten {NODE_ID}"
  },
  { "name": "Uptime",
    "href": "stats/dashboard/db/node-byid?var-nodeid={NODE_ID}",
    "thumbnail": "stats/render/dashboard-solo/db/node-byid?panelId=2&fullscreen&theme=light&width=600&height=300&var-nodeid={NODE_ID}"
    "caption": "Knoten {NODE_ID}"
  }
]
In order to have statistics images available, you have to set up an instance of each Prometheus and Grafana.
globalInfos (array, optional)
This option allows to show global statistics on statistics page depending on following case-sensitive parameters:
namecaption of statistics segment in infoboxhrefabsolute or relative URL to statistics imagethumbnailabsolute or relative URL to thumbnail image, can be the same likehrefcaptionis shown, ifthumbnailis not present (no thumbnail in infobox)
In contrast to nodeInfos there is no template substitution in href, thumbnail or caption.
Examples for globalInfos using Grafana server rendering:
"globalInfos": [
  { "name": "Wochenstatistik",
    "href": "stats/render/render/dashboard-solo/db/global?panelId=1&fullscreen&theme=light&width=600&height=300",
    "thumbnail": "nodes/globalGraph.png",
    "caption": "Bild mit Wochenstatistik"
  }
]
linkInfos (array, optional)
This option allows to show link statistics depending on the following case-sensitive parameters:
namecaption of statistics segment in infoboxhrefabsolute or relative URL to statistics imagethumbnailabsolute or relative URL to thumbnail image, can be the same likehrefcaptionis shown, ifthumbnailis not present (no thumbnail in infobox)
To insert the source or target node-id in either href, thumbnail or caption
you can use the case-sensitive template strings {SOURCE} and {TARGET}.
"linkInfos": [
  { "href": "stats/dashboard/db/links?var-source={SOURCE}&var-target={TARGET}",
    "thumbnail": "stats/render/dashboard-solo/db/links?panelId=1&fullscreen&theme=light&width=800&height=600&var-source={SOURCE}&var-target={TARGET}"
  }
]
siteNames (array, optional)
In this array name definitions for site statistics and node info can be saved. This requires one object for each site code. This object must contain:
sitethe site codenamethe defined written name for this site code
If neither siteNames nor showSites are set, site statistics and node info won't be displayed
Example for siteNames:
"siteNames": [
  { "site": "ffhl", "name": "Lübeck" },
  { "site": "ffeh", "name": "Entenhausen" ),
  { "site": "ffgt", "name": "Gothamcity" },
  { "site": "ffal", "name": "Atlantis" }
]
